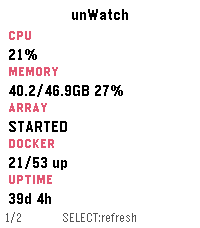
Monitor your unRAID server directly - nobody else sees your data!

A Pebble Time 2 watchapp that shows live stats from an unRAID server on your local network, spread across several pages you can enable/disable in settings. Press SELECT to refresh, swipe or press UP/DOWN to change pages.

Everything happens over your LAN. Your phone talks to the watch over Bluetooth, and the phone talks to Unraid's GraphQL API directly over Wi-Fi. Nothing goes over the internet. You can connect remotely using a service like Tailscale or other VPN.

Pages
Stats  - CPU/memory %, array state, Docker running/total, uptime.
Temperatures - CPU temp and the 3 hottest disks.
Array - capacity (used/free/total in TB) and parity check status.
Virtual machines - running/total count and up to 3 running VM names.
UPS - status, battery %, load %, estimated runtime.
Alerts - unread warning/alert/total counts from Unraid's notification center.

Pages can be disabled as desired.